Open Source Publishing.
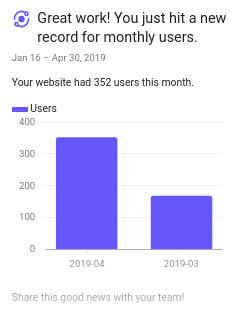
Shows what can be done in a short period of time. I didn’t start building any of this till the beginning of this year.
It’s true that it’s a ton of work to do what I do, but you could use this concept for just one topic instead of 100 and build a valuable resource in a few days!
I will publish monthly stats, though it won’t always be the same, and if you have any requests, pop up in the issues.
Soon, I’ll have comments enabled, and that will be great.
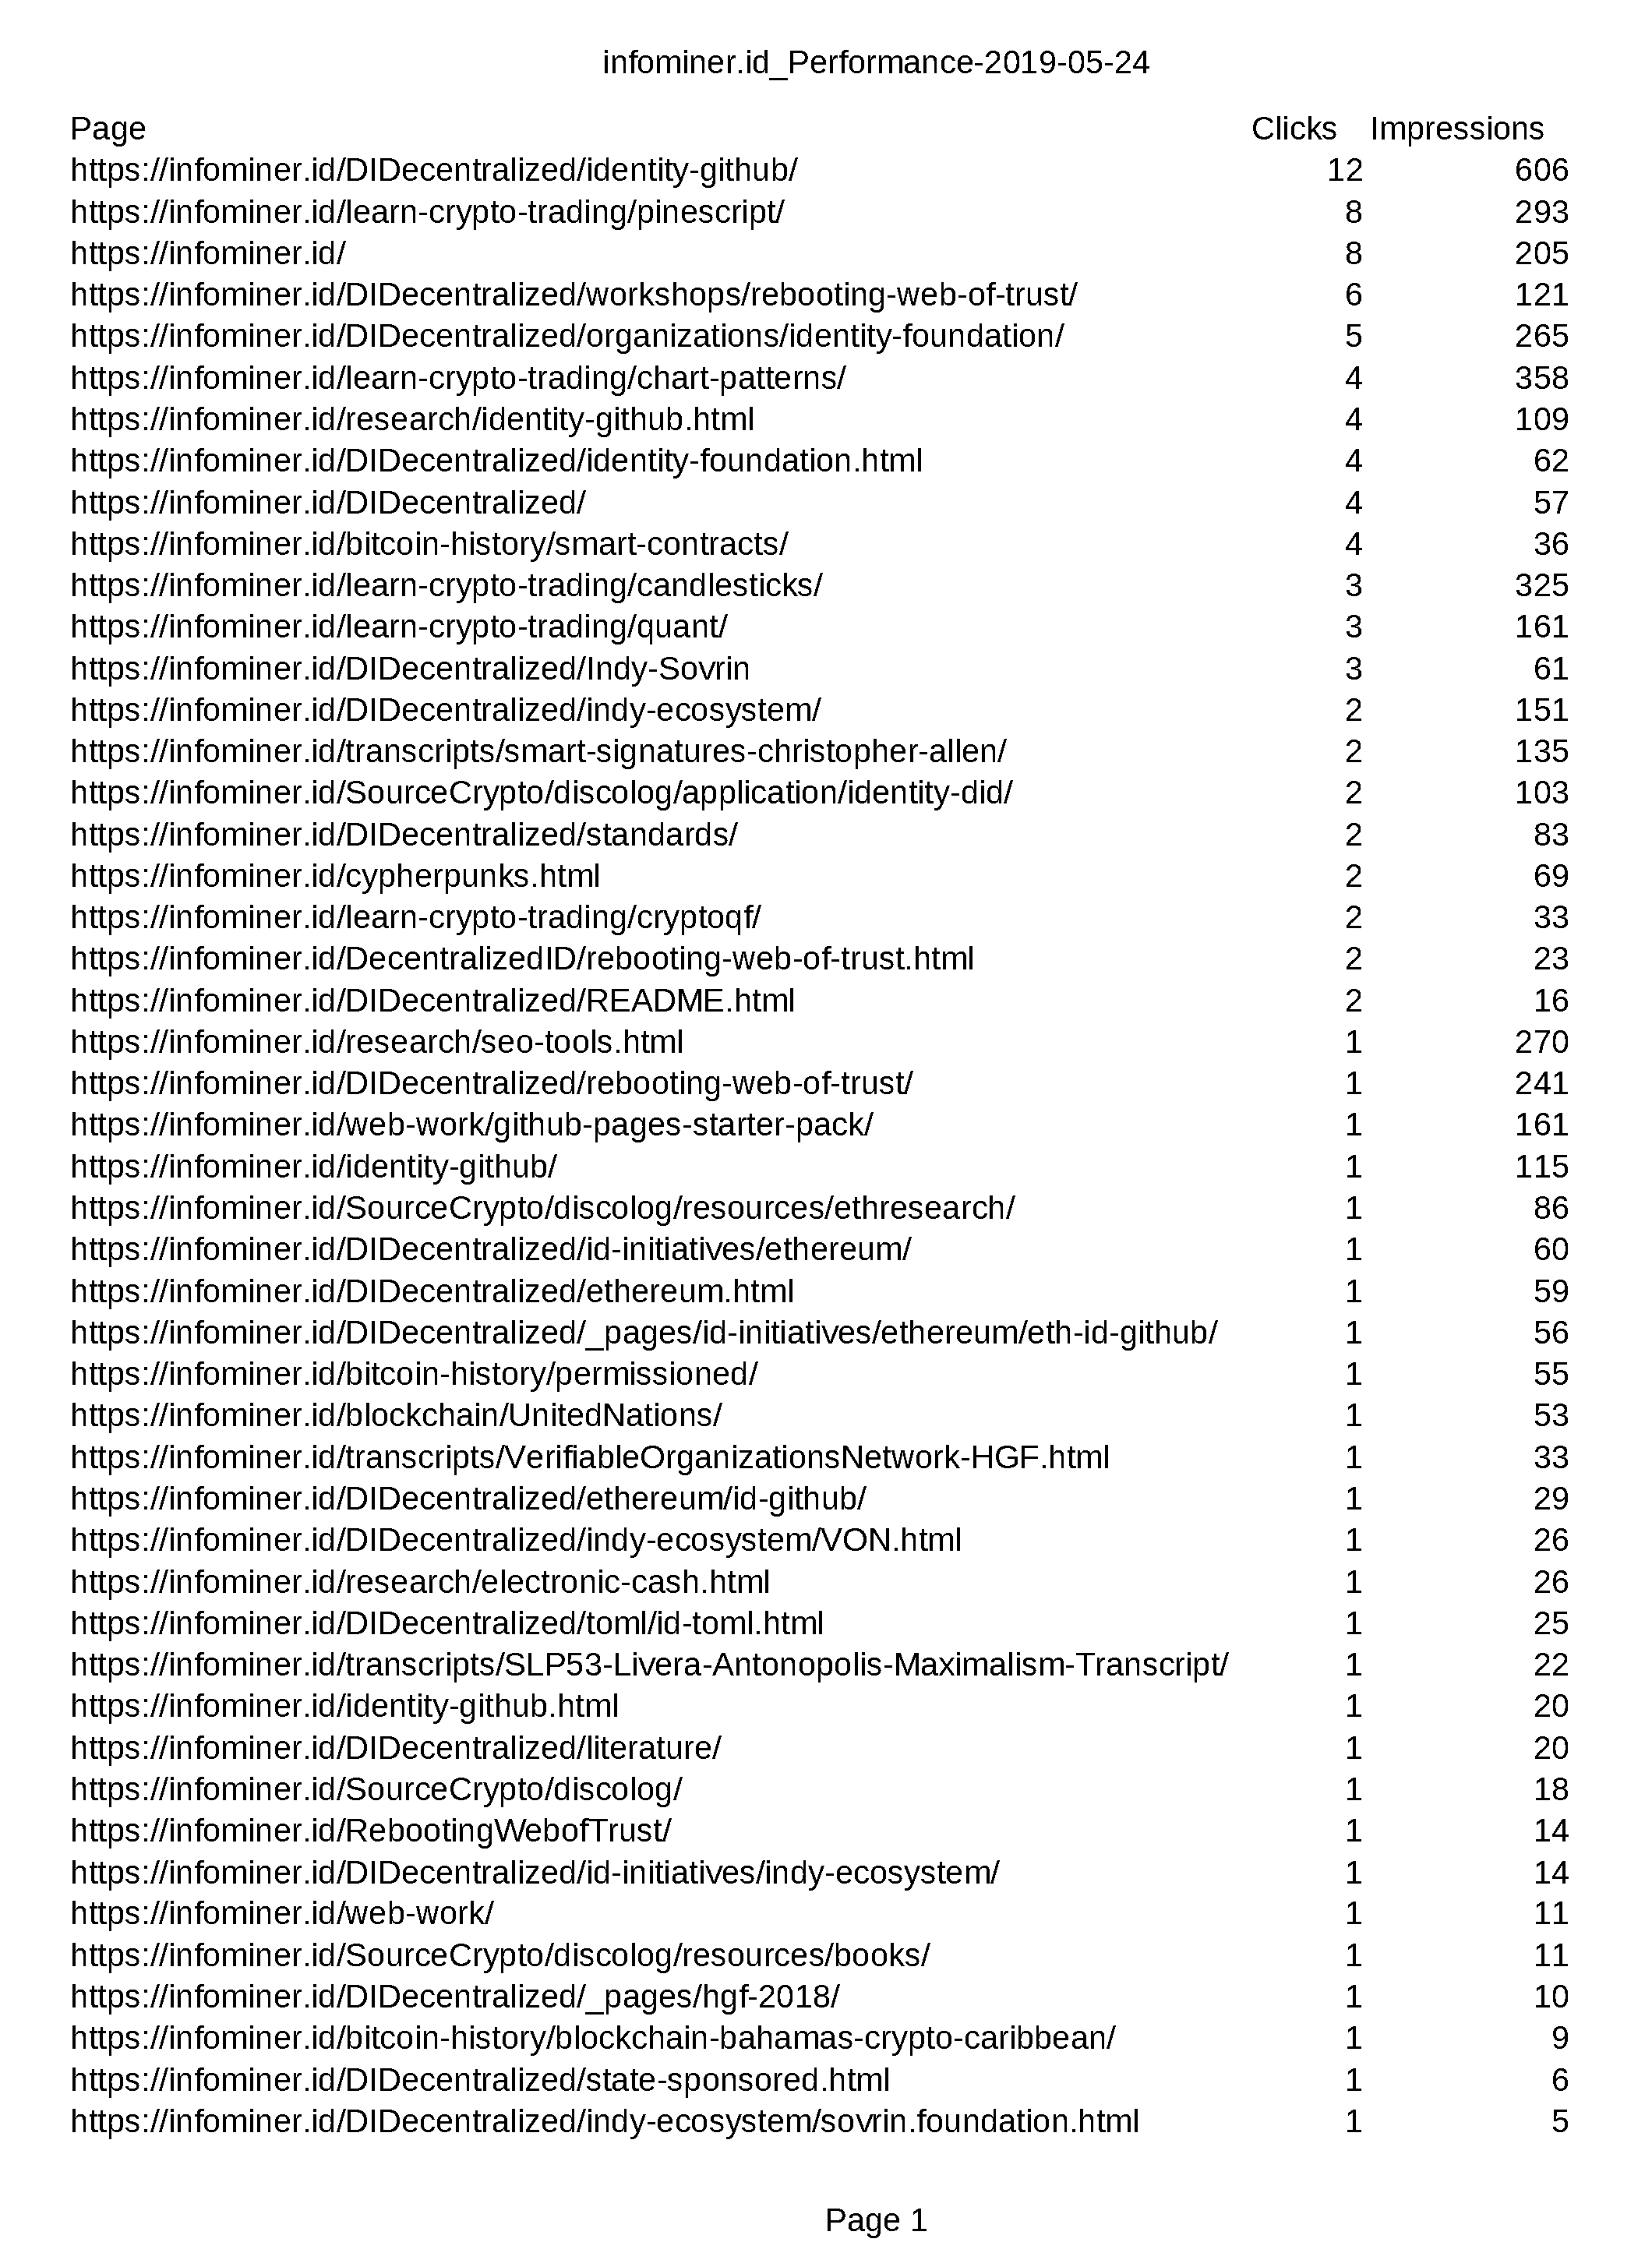
How to present CSV?
Because of multiple columns and long urls, it’s difficult to display this informaiton in text form. It’s easier for me to transform the pdf\csv into png. Then it can be displayed just fine on any screen.
To get a high-quality image, I used convert-my-image.com.
Generating Pages from Data using Liquid
I put performance1.csv and performance2.csv into the /images directory (you can check out on github)
From there, jekyll throws it all up into site.data.performance1 and site.data.performance2 so I can call it with a bit of code and generate pages with it.

As you can see, it’s possible to begin showing up in google pretty quickly. I started building at the beginning of the year, and I hadn’t begun in earnest until you see the chart starting to pop off (around the time I submitted my sitemap to google).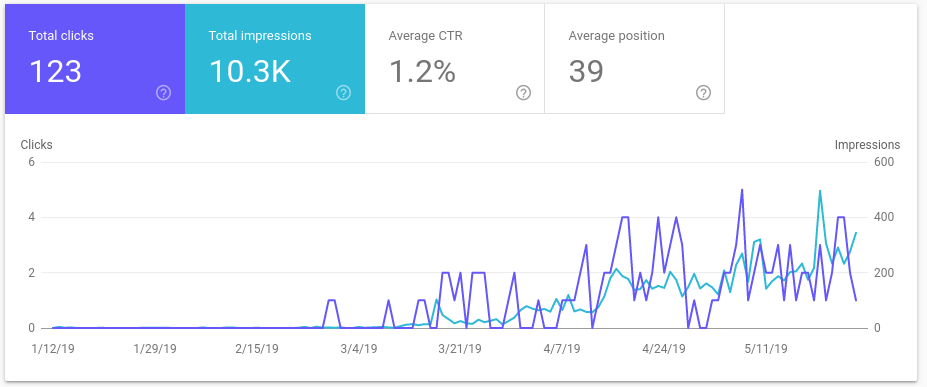

infominer INFO
google organic search stats open source github-pages